One of the most basic nomograms possible simply adds two numbers:
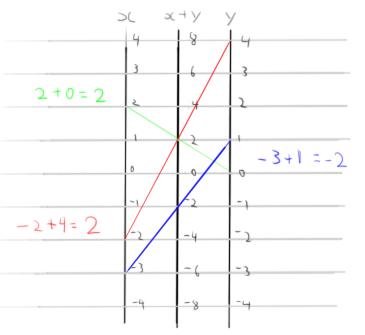 From this simple beginning, it's possible to make other analog computation devices that are much more sophisticated. By using logarithmic axes, you can perform multiplication, since log(x) + log(y) = log(xy).
Nomograms are rather outdated, now that computers can perform numerical calculations much more easily and with far greater accuracy than anyone can measure by hand. The reason I'm looking into nomograms again is because they can be distributed on paper more easily than a computer program, they are relatively intuitive, and they allow very complex systems of equations to be solved by people who don't know math. There are also some iGEM outreach events coming up...
 ...so we'd like to be able to show people mathematical modelling stuff that's related to synthetic biology, but it's hard to come up with stuff that's interesting, learnable in minutes, and true. I think it's possible to condense some tricky work into a graph:
The above graph shows a setup that could calculate the concentration of a molecule and its isomers given a reaction rate constant (provided the axes were properly scaled). This is a fair amount of work (for the creator of the nomogram) when you could just plug "exp(-k*t)" into a calculator, but it's hard to beat the connect-the-dots simplicity of a nomograph. The other nice thing about this type of graph is that it really emphasizes the fact that it's easy to 'cheat' and start with the desired final answer and work backwards to get inputs... ie, design the system analytically.
Unfortunately, the irreversible isomerization reaction is still rather lame and even with an easy method of calculating it, it's still not particularly exciting. What would be cool would be to get a system of equations that describes an optimization problem and have a graph visually represent design trade-offs (like the triangular graph on this page), but that sounds like it might be too ambitious for me to tackle in a couple of spare hours.


Hahaha! The "biologists like math" axis made me actually laugh out loud.
ReplyDeleteThis is a really great idea, dude (for reasons you've summed up quite nicely). You must keep me posted if anything comes of it, outreach-wise or otherwise. :]
So the unfortunate news is that the outreach event decided to avoid math and I never did follow up on this.
ReplyDeleteI *do* really want to make some educational/edutaining material about mathematical modelling, although I'll probably do that as a personal project unrelated to iGEM and the focus might be split between synthetic biology and computational neuroscience.
Time permitting. I really like making outreach materials, but research and coding are taking up almost all my time now.